Coliving Experience report 2019
Urban Campus’s mission is to change how people live, work and interact in cities.
We create warm, intimate and optimally designed spaces, to conceive a homelike feeling and create an engaged community. This gives our residents a sense of connection, belonging and meaning. We aim to cultivate the perfect environment for our members to grow together and push their limits, in order to achieve their personal or professional objectives.
A year after launching our first coliving space (and now with 2 coliving residences in Madrid) we wanted to understand how we have impacted our residents’ lives and assess if we are on the right path to achieving our mission.
Beyond that, we wanted to get to know our members a little bit more, to have a clearer idea of who is living within our walls and partaking in our wonderful coliving community.
Back in December 2019 we conducted an in-depth research, into our community of professionals & entrepreneurs, to obtain insights related to:
- Their experience as Urban Campus residents
- How this way of living has impacted them
- Their perception of Urban Campus
- Their personal & professional backgrounds
We are delighted and thrilled to unveil some of the really interesting results in this Coliving Experience Report.
Who are our residents?

We discovered that we have a very international community, with residents coming from over 27 countries.
With such a global demographic, we wondered how many languages were spoken in the community, and were amazed to discover that 64% speak more than 2 languages! (In addition to their mother tongue)
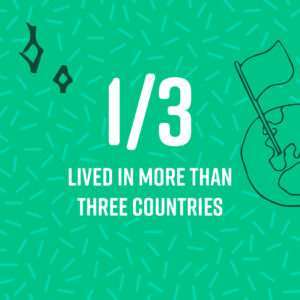
We also found that a third have lived in more than 3 countries. We can say for sure that our residents are open-minded and love to travel and experience new cultures.

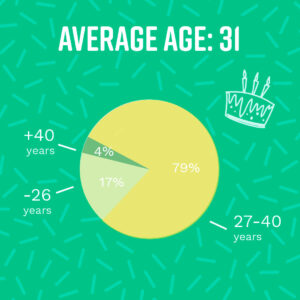
Some people might think that this lifestyle only fits young people but 4% of our residents are over 40, with an average age at 31. 17% are younger than 26 and are young professionals, not students.
The presence of such a wide age range in our spaces proves that no matter the age, coliving can be a good option!
Wondering about their professional lives? 72% of our members use our coworking spaces as their main, or secondary office. 58% of our members are employed by a company, whilst 42% are either entrepreneurs or freelancers, with 38% of them currently employing someone.
We were also interested to find out where our residents lived before moving to our Urban Campus colivings. The answers were majorly heterogeneous, with members having lived with their families, alone, in a shared flat, with their partners, etc. So how come so many people with different prior living situations decide to move to an Urban Campus coliving? The answer can be found in our values; 91% chose us because of our amazing community.
What has been their experience and how did their lives change?

The community is a very important part of our colivings. After moving in, 75% of our members sight our community and networking activities as the thing they love the most about us. Moreover, we are proud to say that 85% of them feel less lonely living here.
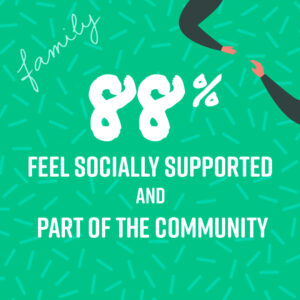
88% feel socially supported and a part of the community. 85% attend at least one Urban Campus event per month. This is certainly thanks to our amazing Community Developers, who we are really proud of !
Our residents have met on average 7,5 people that they can call friends!

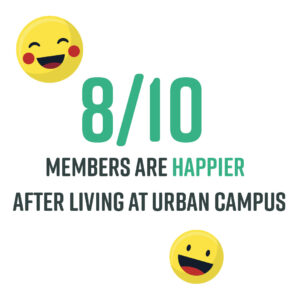
Maybe that is why 8/10 of them are happier now than before arriving at our coliving!
95% would recommend us to a friend, proving that this way of life really covers today’s urbanites needs.
Additionally, we can proudly say that we have received an average score of 8,5!
After reviewing these insights, we think we are on the correct path to achieving our mission. We continue to encourage our members’ growth, learn from them and keep impacting the people that choose to live with us! What do you think?
To explore more of our insights, check out and download the full infographic report by providing us with your Email.
[email-download download_id=”6469” contact_form_id=”6468”]